Average reaction rate: measure the volume of H₂ collected in a syringe over time in the reaction of magnesium with HCl; calculate the average rate at different time intervals and show on a graph that the rate decreases with time; rate tracking via concentration, volume, and color change
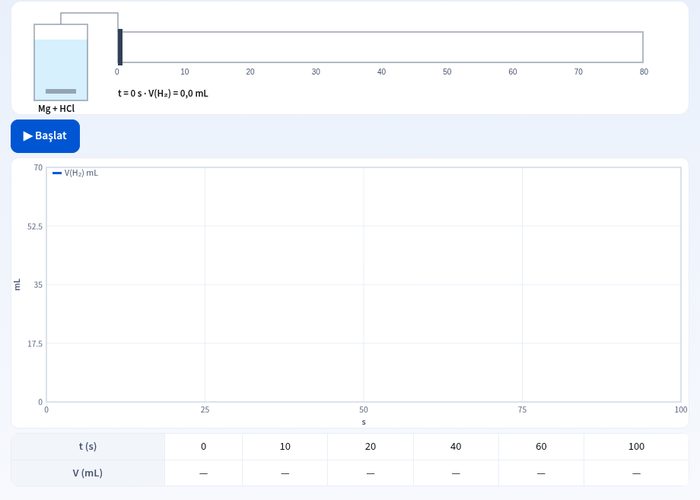
Explore rate changes in chemical reactions interactively with the average reaction rate calculation simulation. In the reaction of magnesium with hydrochloric acid (HCl), you can calculate the average rate at different time intervals by measuring the volume of H2 gas collected in the syringe over time. This experiment helps you grasp why reaction rates decrease over time in chemistry class and allows you to interpret them on a graph.
What can you do in this simulation?
You can start the magnesium and HCl reaction and collect data.
You can observe the volume of H2 gas collected in the syringe at different time intervals.
You can check the results by making average reaction rate calculations.
You can examine the graph changes showing that the rate decreases over time.
You can reinforce your knowledge by answering questions step by step with the guide.
Basic concepts and formulas
Average reaction rate is defined as the change in the amount of substance (concentration or volume) per unit time. In the magnesium and HCl reaction, the rate of formation of hydrogen gas is calculated with the following formula: Average Rate = ΔV / Δt (Volume change / Time interval).
How to use?
Open the experiment panel and read the guide instructions.
Start the magnesium and HCl reaction and wait for data collection.
Examine the volume values at different time intervals.
Perform the requested calculations and check your answer.
Examine the graph results showing the decrease in rate over time.
Frequently asked questions
What is the average reaction rate?
It is the ratio of the amount of reactant consumption or product formation to this time in a given time interval.
Why does the reaction rate decrease over time?
Since the concentration of reacting substances decreases over time, the collision number of particles and therefore the rate drops.
How is the H₂ volume interpreted from the graph?
The slope of the graph gives the reaction rate; as the slope decreases, the reaction rate has also decreased.
 Interactive experiment