Periodic motion: measure the effect of string length, mass, and amplitude on the period in a simple pendulum, and mass and spring constant in a mass-spring system; T–L and T²–L graphs
You can interactively examine the behaviors of a simple pendulum and a spring pendulum with the periodic motions simulation. In this experiment, you will reinforce the topic of waves by measuring the effect of string length, mass, amplitude, and spring constant on the period. You will learn the formulas in physics lessons by practicing.
What can you do in this simulation?
You can observe the effect of string length and mass changes on the period in a simple pendulum.
You can make measurements by changing the mass and spring constant in a spring pendulum.
You can test theoretical knowledge by examining the T-L and T²-L graphs.
You can answer questions step by step with the guidance of the guide and test your predictions with experiments.
You can reach the correct formula relationships by checking the measurement results.
Basic concepts and formulas
Periodic motion is when objects repeat the same motion at equal time intervals. In a simple pendulum, the period is independent of mass and is calculated by the formula T = 2π√(L/g). In a spring pendulum, the period is found by the relation T = 2π√(m/k), where m represents mass and k represents the spring constant.
How to use?
Open the experiment panel and follow the steps guided by the guide.
Make measurements by selecting different length and mass values for the simple pendulum.
Switch to the spring pendulum mode and adjust the mass and spring constant.
Answer the questions by dragging and dropping or tapping the cards into the appropriate boxes.
Check your results and review any missing steps.
Frequently asked questions
Does mass affect the period in a simple pendulum?
No, the period of a simple pendulum does not depend on mass; it depends only on string length and gravitational acceleration.
How does the period of a spring pendulum change?
As the spring constant increases, the period shortens; as the mass increases, the period lengthens.
What does the T²-L graph represent?
This graph visualizes the direct proportionality between string length and the square of the period, allowing the calculation of gravitational acceleration.
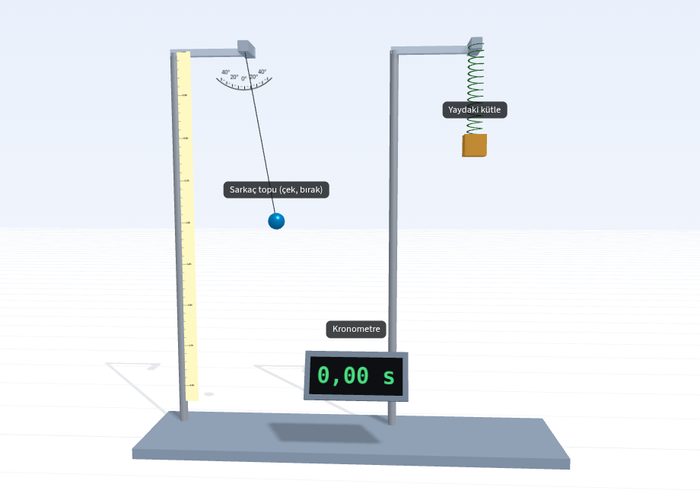 Interactive experiment