Rational function: graph of f(x) = a/(x − h) + k; vertical and horizontal asymptotes, domain and range; inverse proportion model (speed–time on a fixed path)
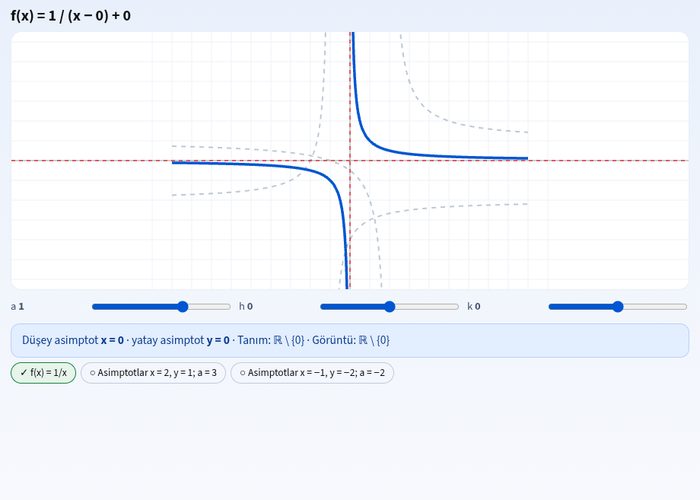
With the rational function and its qualitative properties simulation, you can interactively examine the graphs, vertical and horizontal asymptotes of rational functions in the form of f(x) = a/(x - h) + k. This rational function simulation allows students to discover the domain and codomain of functions, inverse proportion models, and graph variations. You can learn this important topic in mathematics by practicing.
What can you do in this simulation?
You can observe the changes in vertical and horizontal asymptotes of rational function graphs.
You can examine inverse proportion models, such as the speed-time relationship on a fixed path.
You can discover the behaviors of hyperbolas by changing the parameters of the function.
You can solve interactive questions and test your guesses with the guidance of the mentor.
Basic concepts and formulas
The basic rational function is generally expressed as f(x) = a/(x - h) + k. Here, the line x = h indicates the vertical asymptote, and the line y = k indicates the horizontal asymptote. In inverse proportion models, the relation x · y = k is used, and the graph forms a hyperbola on the Cartesian plane.
How to use?
Go to the experiment panel and examine the parameters of the rational function.
Evaluate the questions and guesses by reading the guide's directions.
Match the cards or values by dragging and dropping them into the appropriate boxes.
Verify your answers by clicking the check button and see your shortcomings.
Frequently asked questions
How are the asymptotes of rational functions found?
The x values that make the denominator zero give the vertical asymptote, while the constant y value that the function approaches as x goes to infinity gives the horizontal asymptote.
What topics does this simulation cover?
Covers rational functions, qualitative properties, asymptotes, and inverse proportion models within the scope of the 4th Theme of the Mathematics course.
What does the parameter a change in the graph?
The parameter a affects the opening width, direction, and stretching ratio of the branches of the graph relative to the axes.
 Interactive experiment