Quadratic function: forms f(x) = a(x − r)² + k and ax² + bx + c; vertex, axis of symmetry, roots and discriminant (Δ); highest point and ground impact in a cannonball model
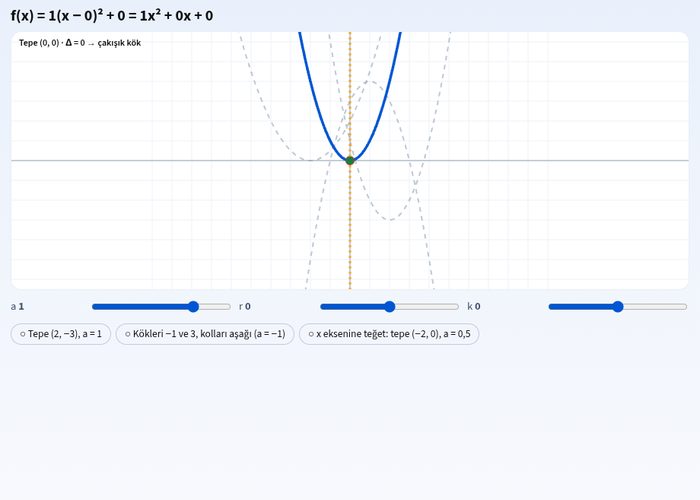
Discover the world of parabolas and examine function graphs interactively with the quadratic function and qualitative properties simulation. In this experiment, you will find the vertex, axis of symmetry, and roots of functions in the form of f(x) = a(x - r)2 + k and ax2 + bx + c. By reinforcing the topic of quantities and change in mathematics class, you can test the behaviors of function graphs with interactive questions.
What can you do in this simulation?
You can examine the vertex and axis of symmetry of quadratic functions.
You can observe the state of the roots depending on the discriminant (Delta) value.
You can calculate the highest point and the moment of landing in the cannonball model.
You can practice with target parabola capturing tasks.
You can test your knowledge by answering questions step-by-step with the guidance of a guide.
Basic concepts and formulas
Quadratic functions are second-degree polynomials, and their general form is f(x) = ax2 + bx + c. The vertex form is expressed as f(x) = a(x - r)2 + k; where (r, k) gives the coordinates of the vertex. The discriminant formula is Delta = b2 - 4ac, which determines the number of roots of the equation. The equation for the axis of symmetry is calculated with the expression x = -b / (2a).
How to use?
Go to the experiment panel and examine the parameters of the quadratic function.
Follow the guide's directions to read the questions and record your thought.
Match the cards by dragging and dropping them into the appropriate boxes or by tapping.
Capture the targets by entering the launch values in the cannonball model.
Check your results and review the questions you missed.
Frequently asked questions
What is the graph of quadratic functions called?
The graph of quadratic functions has a curved shape called a parabola. The arms of the parabola point upward or downward depending on the sign of the coefficient 'a'.
What does the vertex represent in the simulation?
The vertex is the point showing the maximum or minimum value a parabola can take. In the cannonball model, this point represents the maximum height reached by the ball.
What happens if the discriminant (Delta) is less than zero?
If Delta is less than zero, the function has no real roots, meaning the graph does not intersect the x-axis.
 Interactive experiment