Square root function: graph of f(x) = a√(x − h) + k; domain and range, starting point, increasing/decreasing; square root models such as pendulum period
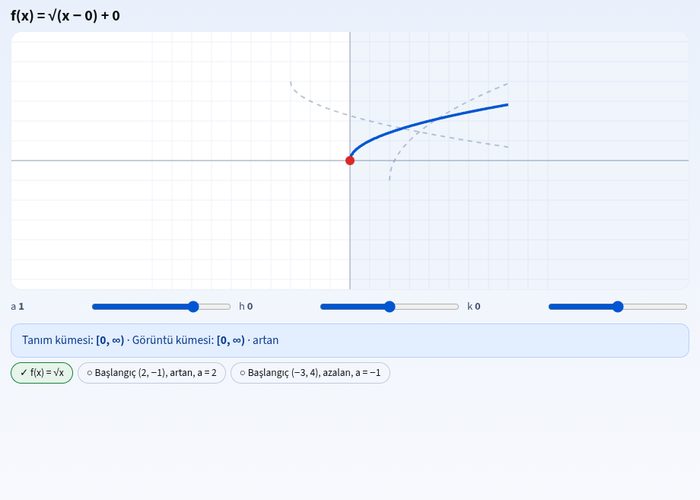
Explore the graphs and qualitative properties of functions of the form f(x) = a√(x − h) + k with the square root function simulation. This interactive tool helps you understand concepts such as domain, range, starting point, and increasingness, aligned with the quantities and change theme in the 10th grade mathematics curriculum. You can learn the behavior of the square root function through interactive steps using real-life models like pendulum period.
What can you do in this simulation?
You can observe how the graph takes shape as the parameters of the square root function change.
You can practice and reinforce your knowledge with target graph capture tasks.
You can analyze expressions inside the root (e.g., 6 − 2x ≥ 0) that affect the domain.
You can answer questions step-by-step with the guidance of the guide and receive instant feedback.
Basic concepts and formulas
The most general form of the square root function is f(x) = a√(x − h) + k. Here, the point (h, k) gives the starting (vertex) point of the function. Since the inside of the root cannot be negative, the domain is determined by the inequality x − h ≥ 0, and the graph extends to the right or left starting from this point.
How to use?
Open the experiment screen and examine the instructions and questions of the guide.
Match cards or target graphs by dragging and dropping them into the relevant areas.
Record your predictions and check your answers using the buttons.
Repeat the experiment by making use of the hints for the steps you got wrong or incomplete.
Frequently asked questions
How do you find the domain of a square root function?
Since the radical index is even, the expression inside the square root must be greater than or equal to zero. For example, by solving the inequality 6 − 2x ≥ 0, the domain x ≤ 3 is obtained.
What is the starting point?
It is the (h, k) coordinates where the graph of the function begins. The graph is not defined before this point.
Where is this function used?
It is used in examining square root models, such as calculating the period of a simple pendulum in physics, and in modeling quantitative changes.
 Interactive experiment