Data analysis: organize survey data from a class; view the same data in column, line, and pie charts; discover which chart suits which question; read the line chart showing change
With the data analysis simulation, you will learn to organize survey data and examine bar, line, and pie chart types. In this interactive experiment, you will discover which chart is suitable for which question and develop your skill in reading change with a line chart. You can easily observe part-whole relationships and changes over time using classroom data.
What can you do in this simulation?
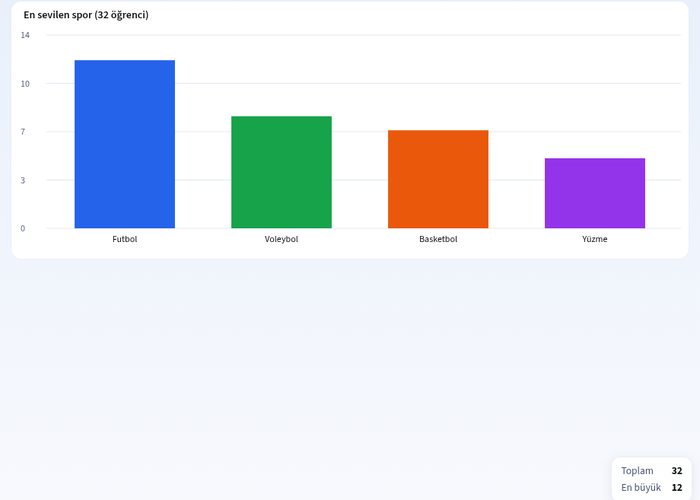
You can organize the class survey data and view it in different chart formats.
You can compare the data using bar charts, line graphs, and pie charts.
You can examine changes over time with examples such as a week's lunchtime temperatures.
You can match information by dragging and dropping cards into the appropriate boxes or columns.
You can make predictions and check your answers to try to reach the correct results on your first attempt.
Basic concepts and formulas
Data analysis is the process of collecting, organizing, and transforming statistical information into meaningful charts. A bar chart is used to compare categorical data, a line graph to show changes over time, and a pie chart to express part-to-whole relationships (as percentages or angles). The formula for the pie slice angle is as follows: Angle = (Data Value / Total Value) · 360°.
How to use?
Start the experiment by reading the instructions in the guide section.
Examine the given cards or questions and tap or drag them to the correct categories.
Test your prediction by clicking the check answer button.
Examine the data from different perspectives by switching between bar, line, and pie chart types.
After seeing the correct answers, fill in your knowledge gaps and try different combinations with the restart button.
Frequently asked questions
In which situations should a bar chart be used?
A bar chart is the ideal chart type to compare numerical data belonging to different categories with each other and to quickly see the largest or smallest values.
What is the difference between a line chart and a pie chart?
While a line chart shows changes and trends over time, a pie chart shows the ratio of parts of a whole within the total in terms of percentages or degrees.
How are the angles of circle slices calculated?
The central angle of the slice in the pie chart is found by dividing the value of each category by the total amount of data and then multiplying by 360 degrees.
 Interactive experiment