Problem solving with linear models: compare two internet plans, find the intersection point (break-even), show which plan is cheaper and when using inequalities and the number line
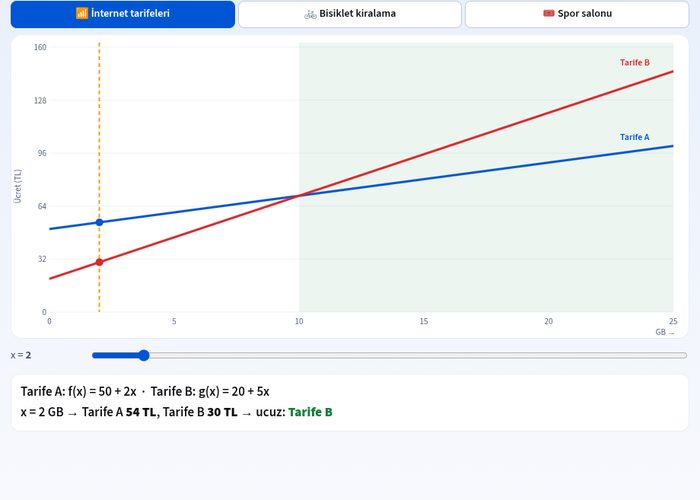
Interactively explore linear models and tariff comparisons in daily life with the Linear Functions with Equation and Inequality Problems simulation. In this application, you will compare two different internet tariffs and perform break-even analyses by finding their intersection points. You can improve your problem-solving skills by applying linear equations from your math class to daily life.
What can you do in this simulation?
You can follow the steps for solving problems with linear models interactively.
You can perform cost analyses by comparing Tariff A and Tariff B options.
You can examine the intersection points of the equations visually with the see on the graph option.
You can test which tariff is more economical and when by finding the intersection and break-even points of the three scenarios.
You can check your solutions and correct your mistakes with guide support and instant feedback.
Basic concepts and formulas
Linear functions are expressed with the general formula f(x) = m·x + n. Here, m represents the slope (unit cost or change), and n represents the initial fixed fee. When comparing two tariffs, the equation f(x) = g(x) is set up, and the x value satisfying this equality gives the intersection (break-even) point.
How to use?
Read the instructions and guide texts on the simulation screen.
Place the cards into the relevant boxes by dragging and dropping or by tapping.
Enter your own hypothesis into the system by using the Save your guess button.
Check your calculations and verify the results by examining the intersection points on the graph.
Try different scenarios again by pressing the Restart button.
Frequently asked questions
What is the break-even point?
It is the intersection point where two different cost or revenue models are equal to each other, meaning profit or loss is zero.
What does a linear function graph represent?
It shows the proportional and constant rate of increase or decrease between variables as a straight line.
What topics does this simulation cover?
helps you reinforce the topics of linear functions, equations, and inequality problems in the mathematics curriculum.
 Interactive experiment