Absolute value function: manipulate the graph of f(x) = a|x − h| + k; vertex, axis of symmetry, minimum/maximum value, piecewise definition; catch the target graphs and see the distance interpretation
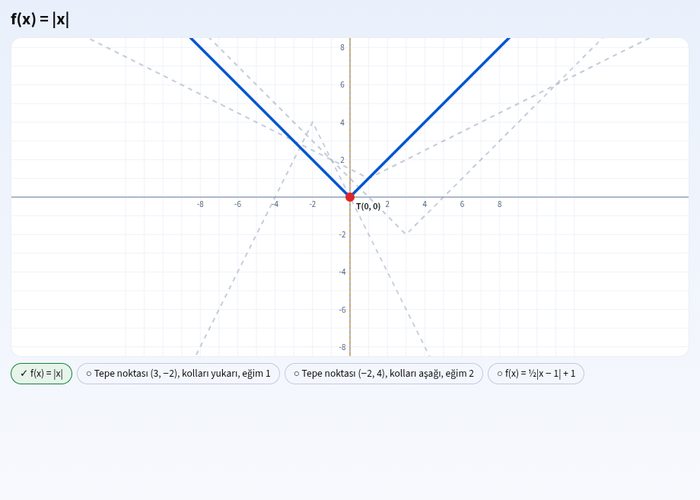
Interactively explore the graphical properties, vertex, and transformations of the function f(x) = a|x − h| + k with the absolute value function simulation. Through this experiment, you will learn the geometric counterpart of functions while reinforcing the theme of quantities and changes in mathematics.
What can you do in this simulation?
You can instantly change the graph by using the coefficients and sliders of the function.
You can observe the vertex, axis of symmetry, and minimum/maximum values.
You can test what you have learned with target graph catching tasks.
You can examine the piecewise definition and distance interpretation of the function.
Basic concepts and formulas
The absolute value function represents the distance of a number from the origin on the number line. The general form is f(x) = a|x − h| + k. Here, (h, k) determines the vertex, and the coefficient a determines the spread and direction of the graph.
How to use?
Open the experiment screen and review the guidance in the guide.
Change the parameters a, h, and k using the sliders.
Check your predictions to match the target graphs.
Answer the questions by dragging and dropping cards into the appropriate boxes.
Frequently asked questions
Why is the graph of the absolute value function V-shaped?
Because the function measures the distance of x values from zero or the vertex, turning negative values into positive ones to form a symmetric arm.
How does the vertex (h, k) affect the graph?
While the parameter h shifts the graph along the horizontal axis, the parameter k performs a vertical translation up or down.
How can I catch the target graphs?
By setting the sliders in the simulation to the correct values, you can ensure it perfectly overlaps with the graph of the target function given on the screen.
 Interactive experiment