Graph of linear equations and slope: draw the line y = mx + n using sliders; see the ratio of vertical change / horizontal change in the slope triangle; compare ramp and stair slopes, and discover positive, negative, and zero slope
You can interactively explore plotting y = mx + n equations visually, the concept of slope, and ramp examples with the graph of linear equations and slope simulation. This tool helps you better understand linear relationships by examining the ratio of vertical change to horizontal change. You can experience step-by-step changes on the graph for lines with positive, negative, and zero slope.
What can you do in this simulation?
You can plot the graph of the line y = mx + n and change the slope by using the sliders.
You can clearly observe the ratio of vertical change / horizontal change on the slope triangle.
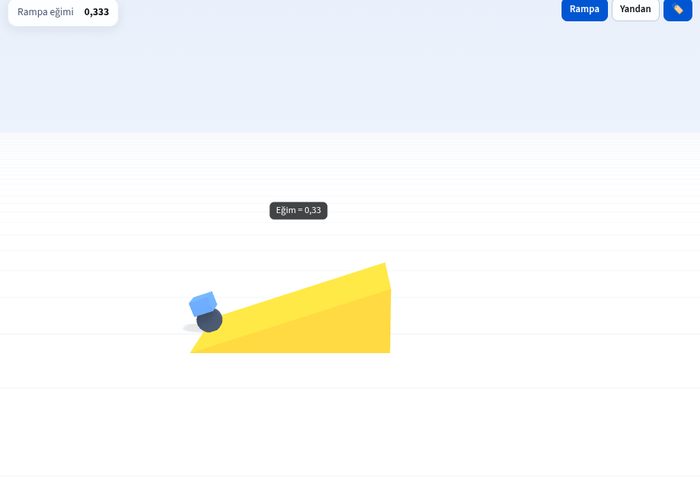
You can compare slope values with real-life examples such as disabled ramp standards.
You can discover the differences between positive, negative, and zero slope types by trying them out.
You can reinforce what you have learned with guided questions and interactive quizzes.
Basic concepts and formulas
In linear equations, a graph represents a straight line in the coordinate system, and its general equation is in the form of y = mx + n. Here, m represents the slope of the line, and n represents the y-intercept. Slope is defined in mathematics as the ratio of vertical change to horizontal change and is calculated with the formula m = (y2 - y1) / (x2 - x1). A positive slope indicates that the line tilts to the right, a negative slope indicates it tilts to the left, and a zero slope indicates a horizontal line.
How to use?
Open the experiment screen to access the graph of linear equations and slope panel.
Change the coefficients by moving the sliders and watch the movement of the line on the graph.
Check the vertical and horizontal change ratios by examining the slope triangle.
Try different slope types (positive, negative, zero) and complete the tasks on the screen.
Frequently asked questions
Can the slope of a line be zero?
Yes, the slope of horizontal lines that do not change along the y-axis is zero because the vertical change is zero.
What does a negative slope mean?
A negative slope indicates that as x increases, the y value decreases, and the line tilts to the left in the coordinate system.
Where does the letter m in the slope formula come from?
The letter m used for slope in mathematics comes from the French verb monter, which means to climb or rise.
 Interactive experiment