Coordinate system and linear relationships: place points on the coordinate plane and learn the quadrants; create a table for a real-world situation like a taxi fare and plot the points, discovering that the points lie on a line and finding its equation
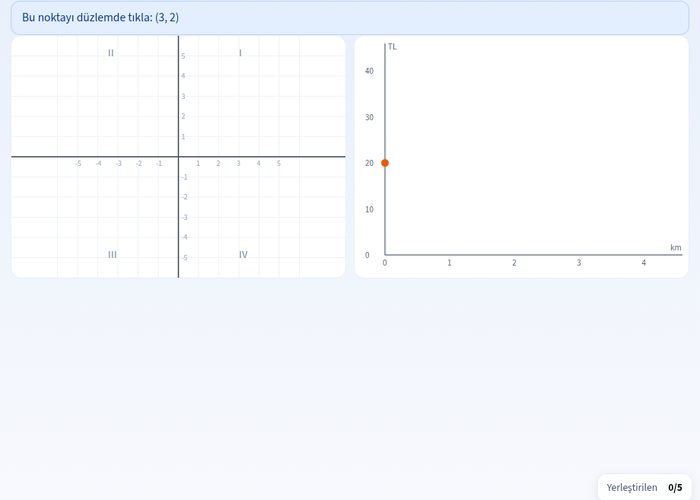
Explore the logic of the Cartesian plane, the locations of points, and the graphical representation of linear equations interactively with the coordinate system and linear relationships simulation. In this experiment, you will learn to plot points on the coordinate plane, identify quadrants, and examine linear relationships belonging to real-life situations, such as a taxi fare, through tables and graphs.
What can you do in this simulation?
You can place points at the correct positions on the coordinate plane using the x (horizontal) and y (vertical) axes.
You can grasp the sign rules by examining the four quadrants of the plane (quadrants I, II, III, and IV).
You can create a table of values corresponding to each kilometer in real-life scenarios like a taxi graph.
You can observe how points representing linear relationships combine on a straight line.
You can test your predictions with the experiment by answering questions accompanied by the guide and receive instant feedback.
Basic concepts and formulas
The coordinate system consists of perpendicular horizontal (x) and vertical (y) axes. A point is expressed as an ordered pair in the form (x, y); for example, the point (-3, 2) is in quadrant II. In linear relationships, the relationship between dependent and independent variables is generally expressed by linear equations in the form y = m·x + n.
How to use?
Open the experiment to examine the coordinate system and linear relationships interface.
Follow the guide's instructions to drag and drop cards or points into the appropriate boxes or positions.
Plot points for scenarios such as a taxi graph by filling in the values in the table.
Verify your answers by clicking the check button and review your missing points.
Continue practicing with different scenarios using the restart button.
Frequently asked questions
Which axis is read first in the coordinate system?
First the horizontal axis x is read, followed by the vertical axis y. Ordered pairs are always written in the form (x, y).
How do I know which quadrant the points are in?
You decide by looking at the signs. For example, (+, +) is in quadrant I, (-, +) is in quadrant II, (-, -) is in quadrant III, and (+, -) is in quadrant IV.
Why does a linear relationship graph form a straight line?
Since the rate of increase between the variables is constant, all calculated points form a straight line when connected on the graph.
 Interactive experiment