Examine others' data: the confounding variable (temperature) in the ice cream sales–drowning incidents example; see how correlation is broken by dragging an outlier; the danger of extrapolation (prediction outside the data range); critique claims
You will critically evaluate statistical data and discover common interpretation errors with the exploring data with two quantitative variables simulation. You will question the real causality behind data while learning concepts like hidden variables, extrapolation, and outliers through examples such as ice cream sales and drowning incidents, or child height changes. This interactive tool is a perfect guide to correctly analyze statistical claims you encounter in media and daily life.
What can you do in this simulation?
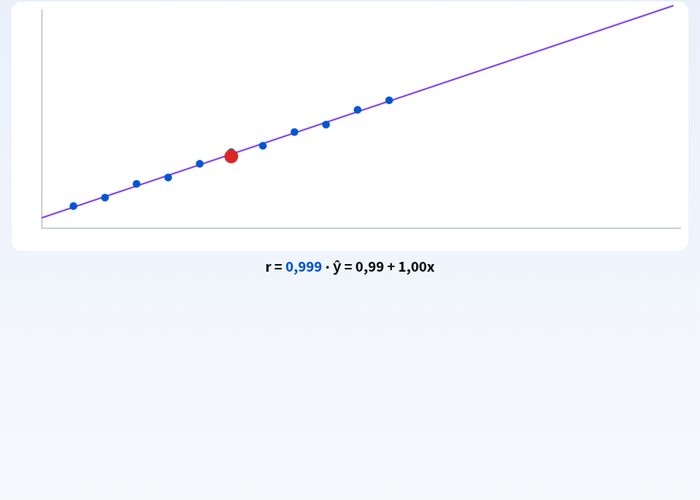
By dragging the red outlier point, you can decrease or increase the correlation coefficient r value, and observe the disruptive effect of outliers on the linear relationship.
In the example of ice cream sales and drowning incidents, you can examine how hidden and common variables like temperature can mislead data.
You can test the illogical results that predictions made outside the data range (extrapolation) will create using children's height growth data.
You can evaluate different given claims and scenarios by matching them with the correct options, and reinforce your knowledge with instant feedback.
You can reset the simulation using the Start Over button and retry different scenarios.
Basic concepts and formulas
In statistical studies, the relationship between two quantitative variables is measured by the correlation coefficient (r). However, correlation does not always mean causation (cause-and-effect relationship). Hidden variables can affect both variables simultaneously as a third factor. Furthermore, extrapolation predictions made by going beyond the current data range (minimum and maximum values) can lead to major errors. The formula r = Σ((x - x_mean)(y - y_mean)) / √(Σ(x - x_mean)^2 Σ(y - y_mean)^2) gives the strength and direction of the linear relationship between two variables.
How to use?
Go to the experiment panel and carefully read the scenarios and claims presented on the screen.
Place them into the relevant boxes by tapping on cards or options, or by dragging and dropping.
Monitor the change in correlation by dragging the red outlier point on the graph.
Instantly see the accuracy of your predictions by pressing the check button.
Review the steps where you made mistakes or fell short, and repeat the experiment guided by the instructions.
Frequently asked questions
Why doesn't correlation always mean causation?
Even though two variables appear to increase or decrease together, this does not show that one causes the other. In the background, there may be a hidden confounding variable (such as air temperature) affecting both.
How do outliers affect the correlation coefficient?
A single extreme point (outlier) added later to the dataset or measured erroneously can completely mislead the r value, which indicates the strength of the linear relationship, and destroy a strong relationship.
What is extrapolation and why is it dangerous?
It is the process of making predictions for values outside the boundaries of your dataset. The assumption that the current trend will continue indefinitely in the same way can lead to illogical and unrealistic results.
 Interactive experiment