Two quantitative variables: add and drag points on a scatter plot; live calculation of correlation coefficient r and the least squares regression line; create positive, negative and uncorrelated data sets; make predictions with the line
Explore the statistical research process with the two quantitative variables simulation and learn the correlation coefficient by adding and dragging data points on a scatter plot. This interactive tool allows you to visualize the relationship between two quantitative variables and analyze data sets.
What can you do in this simulation?
You can add points to the scatter plot and drag the points as you wish.
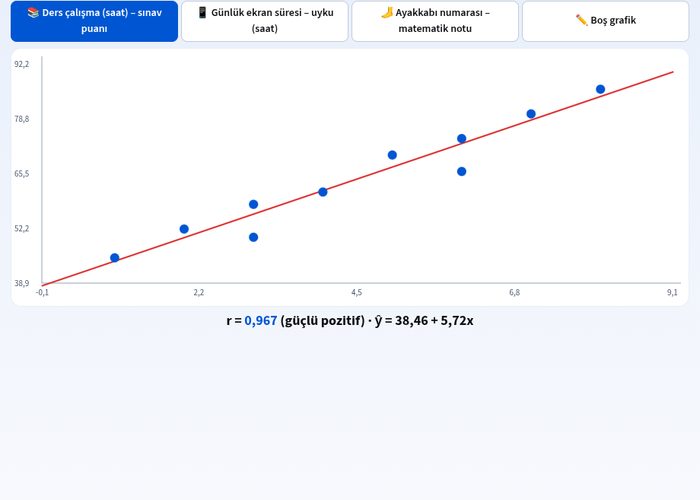
You can instantly track the live-calculated correlation coefficient r value.
You can examine the least squares regression line and make predictions along the line.
You can create positive, negative, and uncorrelated data sets and observe the differences between them.
You can test different scenarios such as daily screen time, sleep hours, and study time.
Basic concepts and formulas
We measure the strength and direction of the linear relationship between two quantitative variables using the correlation coefficient (r). The r value ranges between -1 and 1; r = 1 indicates a perfect positive correlation, r = -1 indicates a perfect negative correlation, while r = 0 indicates no linear relationship. The equation of the line of best fit to the data points using the least squares method is calculated as y = mx + b.
How to use?
Select the data set or scenario you want to examine.
Add new points to the scatter plot or drag existing points.
Examine the changes in the correlation coefficient r and the regression line as you reposition the points.
Check the results by making predictions based on the positive, negative, or uncorrelated data sets you created.
Frequently asked questions
What does the correlation coefficient r represent?
The r coefficient indicates the direction and strength of the linear relationship between two quantitative variables. Positive values indicate an increase together, while negative values indicate that one increases while the other decreases.
What is the regression line used for?
The regression line is the line of best fit for the points on a scatter plot, and we can use this line to make predictions about unknown values.
How do outliers affect correlation?
Extreme points or outliers on the graph can significantly alter the correlation coefficient r value and the slope of the regression line.
 Interactive experiment