Theme 1: Statistical Investigation Process
grade 11 mathematics · theme 1
1.1 Data with Two Quantitative Variables
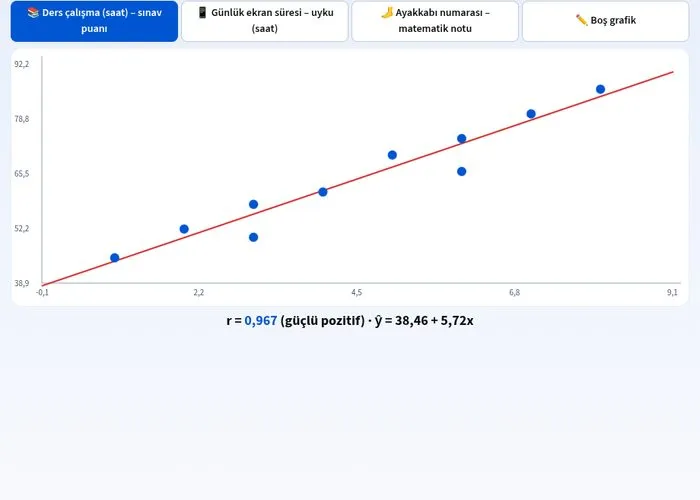
Two quantitative variables: add and drag points on a scatter plot; live calculation of correlation coefficient r and the least squares regression line; create positive, negative and uncorrelated data sets; make predictions with the line
Open Simulation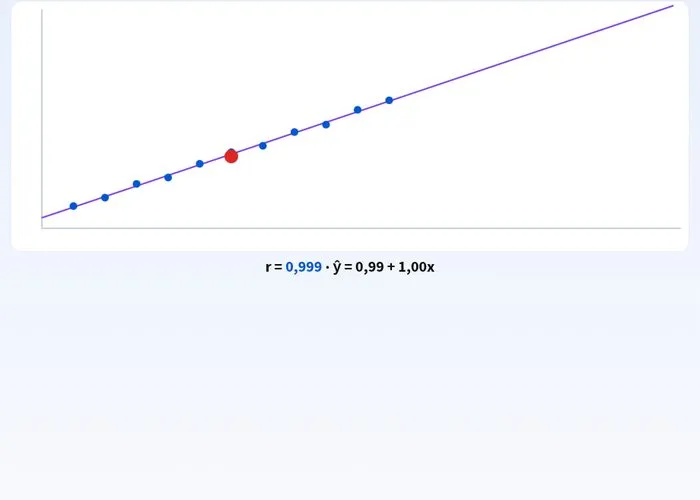
1.2 Examining Data with Two Quantitative Variables Generated by Others
Examine others' data: the confounding variable (temperature) in the ice cream sales–drowning incidents example; see how correlation is broken by dragging an outlier; the danger of extrapolation (prediction outside the data range); critique claims
Open Simulation