Critically examine data created by others: fix misleading charts with broken axes, notice biased sampling, catch percentage and number confusion; reliable research criteria
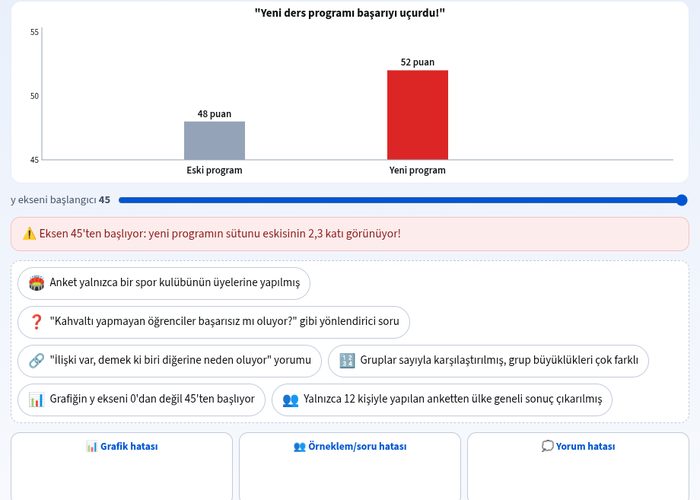
With the simulation for analyzing data with two categorical variables, you will learn to critically evaluate misleading graphs, biased samples, and faulty interpretations in statistical studies prepared by others. This interactive tool helps you improve your statistical literacy and spot manipulated data. ## What can you do in this simulation? - You can examine misleading graphs with broken axes and perform correct scaling by starting the y-axis from zero. - You can notice biased and inadequate samples conducted only with members of a sports club or small groups. - You can perform data analysis by detecting leading questions and percentage-number confusions. - You can catch the errors of confusing the relationship between two categorical variables with a cause-and-effect relationship. - You can create the correct graph columns in scenarios such as comparisons of old and new programs. ## Basic concepts and formulas A reliable statistical study requires a representative and sufficiently sized sample, unbiased questions, accurate graphs, and logical interpretations supported by the data. Incorrectly scaled graphs (for example, a y-axis that does not start from zero) manipulate visual perception, making small changes that actually exist appear massive. ## How to use? 1. Read the simulation instructions from the guide panel and start examining the data. 2. Place the cards and graphs into the relevant boxes or columns using drag-and-drop or by tapping. 3. Adjust the y-axis setting of the graph to ensure the columns reflect the truth. 4. Test your answers and review your mistakes by pressing the check button. ## Frequently asked questions ### What is the most common mistake when examining data with two categorical variables? The most common mistakes are exaggerating increases by using a broken y-axis, selecting inadequate or biased samples, and misinterpreting correlation as causation. ### Why should the y-axis of graphs start from zero? Failing to start the y-axis from zero misleads the reader by causing the differences between data to appear much larger than they actually are. ### What features should a reliable study have? A reliable study must rely on an unbiased and sufficiently large sample, contain non-leading questions, and have graphs scaled in accordance with mathematical accuracy.
 Interactive experiment