Data with two categorical variables: create a cross-tabulation (two-way table) from a school survey, calculate row and column percentages, interpret whether there is a relationship between variables in a stacked bar chart
Discover the statistical research process with the data with two categorical variables simulation and learn how to create cross-tabulations through a school survey. Thanks to this interactive tool, you can easily interpret potential relationships between variables on a stacked bar chart by calculating row and column percentages. It is a great application to reinforce high school mathematics statistics topics.
What can you do in this simulation?
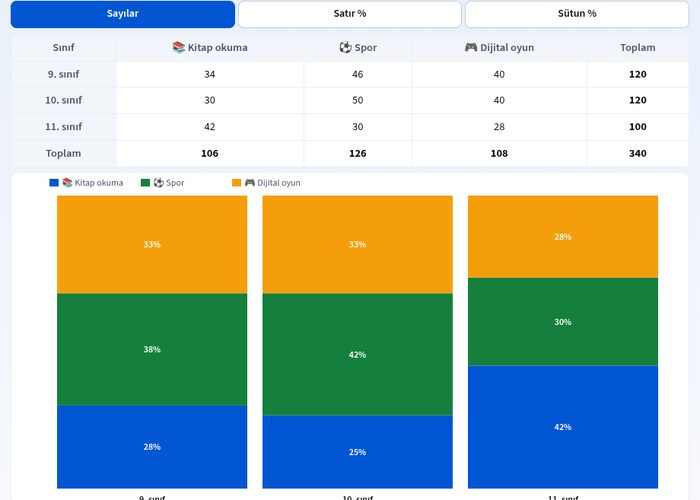
You can create a two-way cross-tabulation using school survey data.
You can switch between count, row percentage, and column percentage views.
You can examine the differences between classes regarding book reading, sports, and digital gaming preferences.
You can place the given data into the relevant boxes by dragging and dropping the cards.
You can interpret the relationships between variables by observing the changes on the graph.
Basic concepts and formulas
The most fundamental tool in examining data with two categorical variables is cross (two-way) tables. In these tables, frequencies and percentages are calculated to understand the data distribution. While the row percentage formula is expressed as P(Row) = (Cell Value / Row Total) · 100, the column percentage is expressed as P(Column) = (Cell Value / Column Total) · 100. Thanks to these ratios, groups of different sizes can be compared fairly.
How to use?
Examine the survey data by following the guide on the experiment screen.
Place the cards into the appropriate boxes by tapping or dragging and dropping.
Select the count, row %, or col % view from the cross-tabulation panel.
Interpret the differences between classes and activity preferences by examining the stacked bar chart.
Frequently asked questions
What is a cross-tabulation and what is it used for?
A cross-tabulation is a two-way data table that allows the simultaneous examination of two or more categorical variables. It makes it easier to see frequency distributions and proportions between variables.
What is the difference between row percentage and column percentage?
The row percentage gives the proportion of the total relative to the row, while the column percentage gives the proportion of the total relative to the column. Which percentage you choose depends on what you want to compare in the research.
Does having a relationship between two variables mean a cause-and-effect relationship?
No, a statistical relationship or correlation indicates that two variables change together, but it does not prove a definite cause-and-effect connection.
 Interactive experiment