Theme 2: Statistical Investigation Process
grade 10 mathematics · theme 2
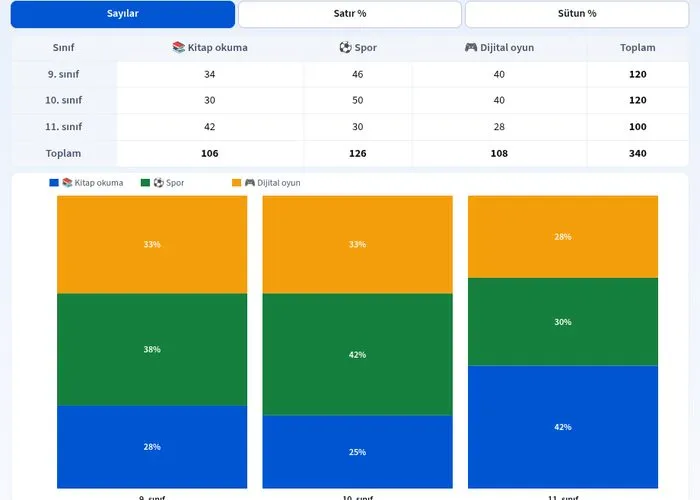
2.1 Data with Two Categorical Variables
Data with two categorical variables: create a cross-tabulation (two-way table) from a school survey, calculate row and column percentages, interpret whether there is a relationship between variables in a stacked bar chart
Open Simulation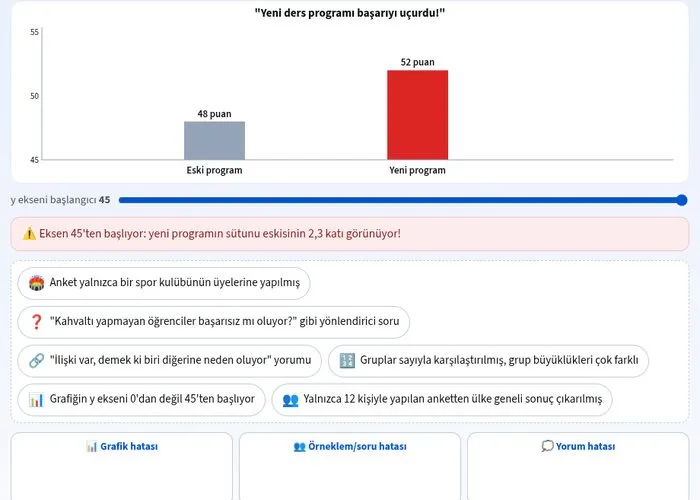
2.2 Examining Data with Two Categorical Variables Created by Others
Critically examine data created by others: fix misleading charts with broken axes, notice biased sampling, catch percentage and number confusion; reliable research criteria
Open Simulation