Trigonometric functions: watch the genesis of sine and cosine graphs from the projections of a point rotating on the unit circle; change amplitude, period, phase shift and vertical translation with sliders in f(x) = a·sin(bx + c) + d; catch the target waves
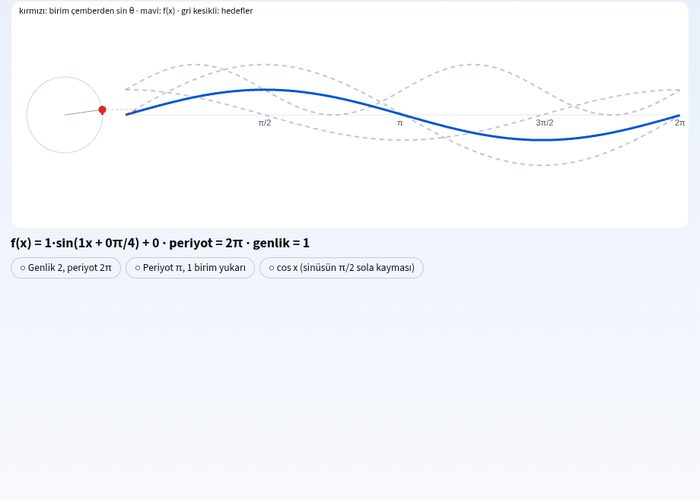
Explore interactively how motion on the unit circle transforms into sine and cosine waves with the trigonometric functions simulation. Thanks to this experiment, you will reinforce mathematics and trigonometry topics by visualizing the graphical changes of the function f(x) = a·sin(bx + c) + d.
What can you do in this simulation?
You can follow the horizontal and vertical projections of the point rotating on the unit circle.
You can change the amplitude, period, phase shift, and vertical translation parameters using the sliders.
You can compare the graphs of sine and cosine functions by examining the red and blue curves.
You can adjust the correct coefficients to catch the target waves shown with grey dashed lines.
You can progress step by step with the guide, answer the questions, and increase your score.
Basic concepts and formulas
Trigonometric functions are the projections of angle values on the unit circle onto the coordinate axis. The general form is expressed as f(x) = a·sin(bx + c) + d. Here, a determines the amplitude (width), b the period (T = 2π / |b|), c the phase shift, and d the vertical translation of the graph.
How to use?
Open the experiment screen and follow the guide's instructions.
Change the coefficients of the function using the parameter sliders.
Observe the effect of the motion on the unit circle over the resulting wave.
Enter the values required to catch the target waves and press the check button.
Review the results and repeat the steps where you feel deficient.
Frequently asked questions
How does the amplitude parameter affect the graph?
The amplitude, or value a, determines how much the peak and trough points of the wave will stretch or compress along the vertical axis.
What is the formula for the period and what does the coefficient b do?
The period is the time it takes to complete one full wavelength and is calculated with the formula T = 2π / |b|. As the coefficient b increases, the wave compresses horizontally.
What does the phase shift show on the graph?
The phase shift, or value c, causes the wave to shift to the right or left along the horizontal axis.
 Interactive experiment