Uniformly accelerated motion: measure the acceleration of a cart on an inclined track, the slope of the velocity-time graph is acceleration, the area is displacement; position-time parabola; reaction time and speed-dependent stopping distance
Discover the most fundamental kinematic concepts in physics interactively with the one-dimensional constant acceleration motion simulation. With this experiment, you can easily learn how to measure the acceleration of a car on an inclined track and the physical meanings of velocity-time and position-time graphs. It is an ideal resource for reinforcing the relationship between velocity and acceleration.
What can you do in this simulation?
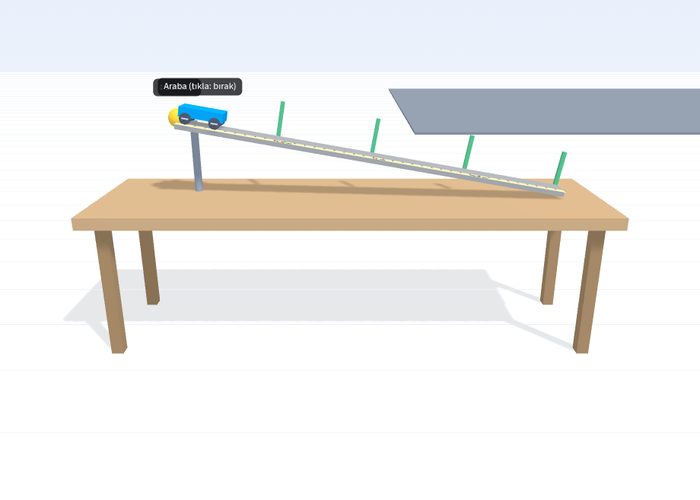
You can make acceleration measurements at different inclination angles by releasing the car on the inclined track.
You can examine how the slope of the velocity-time graph gives the acceleration and the area under the graph gives the displacement.
You can track the uniformly accelerated motion of the object by observing the position-time parabola.
You can test the effect of reaction time and vehicle speed on stopping distance with the brake experiment.
By answering guided questions, you can reinforce your theoretical knowledge with practice and test your predictions with the experiment.
Basic concepts and formulas
In constant acceleration motion, the relationship between velocity, acceleration, and time is expressed by the formula v = v₀ + a·t. Displacement is calculated by the relation x = v₀·t + (1/2)·a·t². While the slope of the velocity-time graph gives us the acceleration at any moment (a = Δv / Δt), the area under the graph shows the total displacement.
How to use?
Open the experiment panel and follow the steps guided by the guide.
Start the motion of the car at at least 3 different inclinations on the inclined track and record the acceleration measurements.
Check the data by examining the velocity-time and position-time graphs.
Observe the stopping distance by changing the velocity and reaction time parameters in the brake experiment section.
Frequently asked questions
What does the slope of the velocity-time graph give us?
The slope at any given instant on the velocity-time graph gives the acceleration of that object at that instant. In cases where the acceleration is constant, the acceleration is also constant.
Why does the position-time graph draw a parabola?
The distance traveled by an object moving with constant acceleration increases quadratically (t²) with respect to time. Mathematically, this causes the graph to take the shape of a parabola.
How does reaction time affect stopping distance?
The vehicle continues to travel during the time elapsed from when the driver notices the obstacle until they press the brake. As the speed increases and the reaction time lengthens, the total stopping distance also increases in direct proportion.
 Interactive experiment