Motion at constant speed: two runners on a track divided into 2 m sections; measure time at checkpoint markers, draw position-time and velocity-time graphs; slope = velocity; meeting and overtaking problems
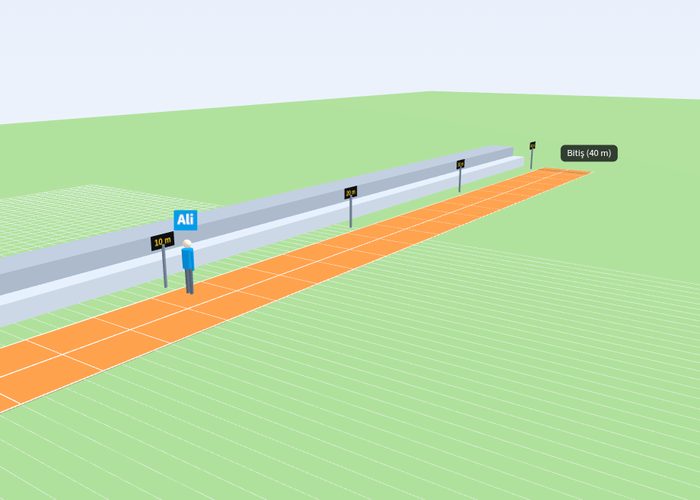
With the constant velocity motion simulation, you can examine the motion of two runners on a track divided into 2-meter sections, and discover the laws of physics by measuring time at marked points. This interactive experiment allows you to learn how to draw position-time and velocity-time graphs, interpret the slope of the graphs, and solve meeting and overtaking problems. It is a great resource to reinforce kinematics topics in physics lessons with interactive questions.
What can you do in this simulation?
You can make running trials with different speed values on the track divided into 2-meter sections.
You can collect data by taking time measurements at marker points.
You can create and examine position-time and velocity-time graphs.
You can test catching up and meeting problems on the simulation.
You can test your predictions with experiments by answering interactive questions accompanied by a guide.
Basic concepts and formulas
Uniform motion is the type of motion where objects cover equal distances in equal time intervals. In this motion, acceleration is zero and velocity is constant. The slope of the position-time graph gives us the velocity. The basic formula is as follows: x = x0 + v·t (Where x is final position, x0 is initial position, v is velocity, and t is time).
How to use?
Open the simulation screen and follow the guide instructions.
Determine at least 3 different velocity values for the runners on the track.
Record the data by measuring time at marker points.
Answer the questions by examining the position-time and velocity-time graphs.
Frequently asked questions
How is velocity found in the constant velocity motion simulation?
The slope of the position-time graph (delta x / delta t) gives the velocity of the moving object. You can easily calculate the velocity by examining the changes in the graph.
What does the position-time graph show?
It shows at which position the object is at a given moment. Since the slope of the line is constant, we understand from here that the velocity is also constant.
How are overtaking problems solved in this simulation?
By testing the speed and initial position values of two different runners on the track, it is observed when and where the trailing moving object will catch up with the leading one.
 Interactive experiment