Four operations on functions: construct graphs of (f + g), (f − g), (f·g), and (f/g) point-by-point from graphs of f and g; exclusion of points where g(x) = 0 from the domain of f/g; revenue − cost = profit model
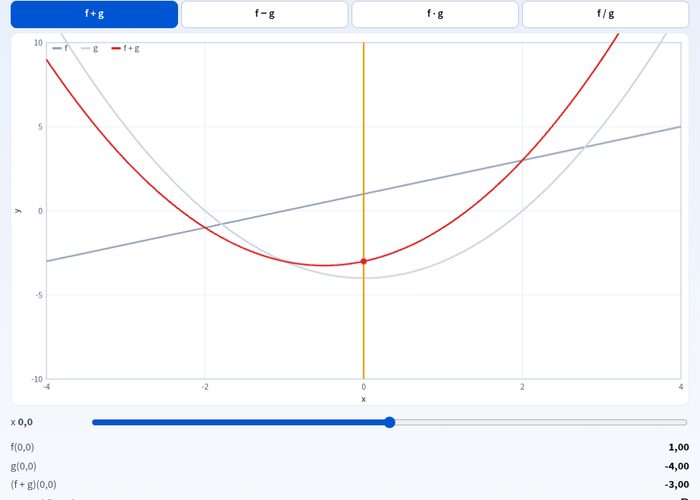
With the four operations on functions simulation, you can easily learn addition, subtraction, multiplication, and division based on the graphs of two different functions. In this interactive activity, you can precisely construct the graphs of (f + g), (f − g), (f·g), and (f/g) using the graphs of f and g, improving your skill in performing operations with functions. Additionally, you can create a profit model for real-life problems using revenue and cost data and find the maximum profit.
What can you do in this simulation?
You can examine the graphs of the functions f and g, and create new function graphs by matching the points.
You can perform addition, subtraction, multiplication, and division (f + g, f − g, f·g, f/g) step by step.
You can observe how critical points where g(x) = 0 are excluded from the domain in division.
You can build the profit function model using revenue and cost functions and calculate the maximum profit value.
By proceeding with the help of a guide, you can test your predictions with experiments and get instant feedback.
Basic concepts and formulas
The four operations performed on two functions are defined for each x element in the common domain as follows: The sum function (f + g)(x) = f(x) + g(x), the difference function (f − g)(x) = f(x) − g(x), the product function (f·g)(x) = f(x)·g(x), and the quotient function (f/g)(x) = f(x) / g(x) (g(x) ≠ 0). In commercial and economic problems, the profit function is modeled as Profit(x) = Revenue(x) − Cost(x) as the difference between the revenue function and the cost function.
How to use?
Go to the experiment panel and examine the graphs and data of the functions f and g.
Place cards or points into the desired columns or boxes by dragging and dropping or by tapping.
Generate new function values by selecting the operation type (f + g, f − g, f·g, or f/g).
Test the profit function model with revenue and cost data to find the maximum profit.
Verify your answer by pressing the check button and read the guide's explanations.
Frequently asked questions
Why is the domain important in the division of functions?
Points where the function in the denominator is zero (g(x) = 0) in division must be excluded from the common domain of the function because they create undefinedness.
How is profit calculated from revenue and cost functions?
The profit function is obtained by subtracting the total cost from the total revenue; that is, the formula Profit = Revenue − Cost is used.
How are the four operations between functions performed using a graph?
By applying the requested arithmetic operation to the y-values corresponding to the common x-coordinates (f(x) and g(x)), the points on the graph of the new function are found.
 Interactive experiment